 The unclassed choropleth map shows shadings proportional to the data values so that the choropleth do not have to classify the data. This method of mapping has been generally accepted because cartographers claim that they loose the ability to direct the message of communication. This Unclassed Choropleth represents different populations within Parrish's in France. The darker the shade the larger the population. There are no set ranges between shades on this type of map.
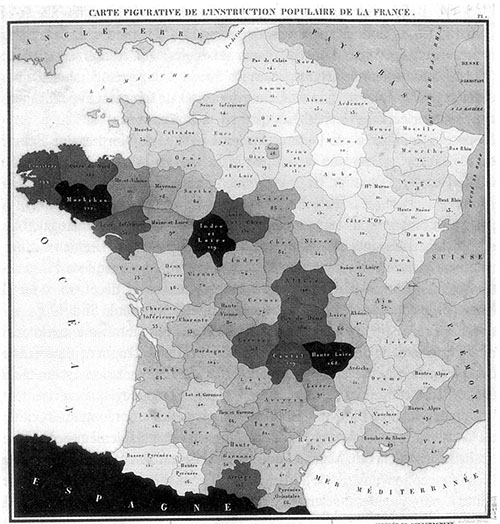
http://indiemaps.com/images/classedCartograms/dupin1826.jpg
No comments:
Post a Comment