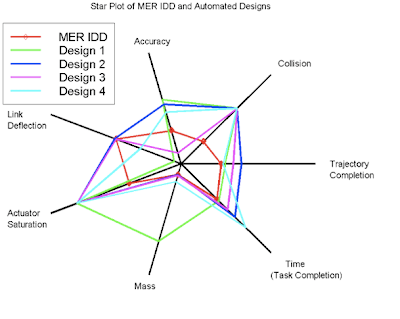
A Star Plot is a geographical method of displaying varying types of data in 2-D. They are represented on axes starting from the same point. It contains a sequence of equi-angular spokes called radii, with each spoke representing one of the variables. Star plots are helpful for small to moderate sized multivariate data sets.
No comments:
Post a Comment