Wednesday, December 2, 2009

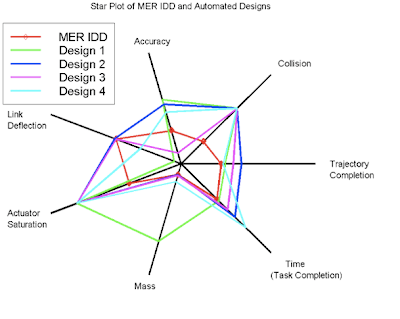
Star Plots


A Star Plot is a geographical method of displaying varying types of data in 2-D. They are represented on axes starting from the same point.  It contains a sequence of equi-angular spokes called radii, with each spoke representing one of the variables.  Star plots are helpful for small to moderate sized multivariate data sets.  


Correlation Matrix


A correlation is a single number that describes the degree of relationship between two variables. A Correlation Matrix lists the individual correlations between any two sets of variables.

To locate the correlation for any pair of variables within the matrix, you would need to find the value in the table for the row and column intersection for those two variables. correlation Matrices are quite similar to similarity matrices, except for that correlations have values ranging only from -1 to 1, with -1 representing the least amount of correlation and 1 representing the greatest.


Similarity Matrix

A similarity matrix is a matrix of scores which express the similarity between two data points. They are used in sequence alignment: higher scores are given to more similar characters, and lower or negative scores are given for dissimilar characters.


Steam and Leaf Plot


A steam and leaf plot display is a graphical method of displaying data. It is particularly useful when your data is not too numerous. It can only show two-place accuracy. Steam and leaf plots are a method for showing which frequency with which certain classes of value occur.

Box Plot

A Box Plot  (also known as a box-and-whisker diagram or plot) is a convenient way of graphically depicting groups of numerical data through their five-number summaries.

Box plots can be drawn either horizontally or vertically.


Histogram


A Histogram is a graphical display of tabulated frequencies, shown as bars. It shows what proportion of cases fall into each of several categories: it is a form of data binning. The categories are usually specified as non-overlapping intervals of some variable. The categories (bars) must be adjacent. The intervals (or bands, or bin) are generally of the same size.


http://www.daisy2000.com/Daisy2003/HorizontalHistogram.gif

Parallel Coordinate Graph


A parallel coordinate graph is used to plot large multivariate data sets.  The strength of parallel coordinates is their ability to bring multivariate patterns and comparisons to light when used interactively for analysis.  The lines are used to encode time series data. 


Triangular Plot


A triangle plot is a graph of 3 variables. It is most often used in geologic studies to show the relative compositions of soils and rocks, but it can be more generally applied to any system of three variables.

The proportions of the three variables plotted always sum to some constant. In DPlot that constant is always the value 100. Because the 3 values for any point always sum to a constant, any one variable is not independent of the others so only two variables must be known.

Windrose

A wind rose is a graphic tool used by meteorologists to give a succinct view of how wind speed and direction are typically distributed at a particular location. Presented in a circular format, the wind rose shows the frequency of winds blowing from particular directions. The length of each "spoke" around the circle is related to the frequency that the wind blows from a particular direction per unit time. Each concentric circle represents a different frequency, emanating from zero at the center to increasing frequencies at the outer circles.
The above wind rose is for Seattle, Washington.


Climograph

A climograph is a graphical depiction of the monthly precipitation and temperature conditions for a selected place. Precipitation is shown by the bar graph. A line graph depicts temperature.

They are a valuable tool in studying climate, but also can be used to infer connections between climate and human conditions.


Population Profile

A population profile can be defined as a chart showing the number of people as a function of their ages for any given location. The above population profile illustrates the breakdown of population by age in the US for the years 1970, 1980 and 1990. 


Scatterplot


Scatter plots are similar to line graphs in that they use horizontal and vertical axes to plot data points. Scatter plots have a very specific purpose in that they show how much one variable is affected by another. The relationship between two variables is called their correlation .

A scatter plot is a useful summary of a set of bi variate data (two variables), usually drawn before workingout a linear correlation coefficient or fitting a regression line. It gives a good visual picture of the relationship between the two variables, and aids the interpretation of the correlation coefficient or regression model.


http://www.mzandee.net/~zandee/statistiek/stat-online/chapter4/graphics/age_scatterplot.gif

Index Value Plot

An index valve plot is defined as a statistical indicator/number derived from a formula, which is used to characterize a set of data.  It helps show discrepancies between data information.

An index value plot is a type of visualization map that is plotted on a line graph. The above graph shows the average stream flow of 65 sites in Mass. from 2001 through 2009.


Lorenz Curve


A Lorenz Curve is a graph showing the proportion of the distribution assumed by the bottom y-values. It can be used to represent income distribution among many other things. The % of households is plotted on the x-axis, and the % of income on the y-axis. This one was developed in 1905 by Max O. Lorenz in 1905 to represent inequality of the distribution of wealth.


Bilateral Graph

Bilateral graphs depict increases and decreases on either side of a zero line. They are used to display data of both positive and negative values. A bi-lateral graph is a visualization map. Two related variables are identified as well as their overlaps. This bilateral graph shows three different variables and there values in terms of number of persons.

Bivariate Choropleth Maps


Bivariate maps display the relationship of two variables. This type of map includes two different sets of graphic symbols or colors. It can solve spatial problems.  In the above map, the relationship of the crime rates in 2003 and the election results from 2004 are displayed.


Unclassed Choropleth Maps

The unclassed choropleth map shows shadings proportional to the data values so that the choropleth do not have to classify the data.  This method of mapping has been generally accepted because cartographers claim that they loose the ability to direct the message of communication.  This Unclassed Choropleth represents different populations within Parrish's in France. The darker the shade the larger the population. There are no set ranges between shades on this type of map.

http://indiemaps.com/images/classedCartograms/dupin1826.jpg

Classed Chloropleth Maps

The classed chloropleth map's main objective is to determine height and shading or color intensity of the bar for each map classed.  This would involve creating a classed frequency legend which includes a frequency histogram and a frequency curve and shading.  This Classed Chloropleth shows the change in divorce rates between 1980-1990 in 48 States. The ranges in shades is in between set numerical increments.

DOQQ


DEM


DLG

This DLG map uses data at a source scale of 1:100,000. DLGs portray info in a linear form.   It contains information such as transportation networks, hydrography, boundaries, elevation contours, and man made features.  A DLG is a cartographic map representing a digital vector distributed by the U.S. Geological Survey.  They are collected in small, intermediate and large categories of features, depending on the scale.  They come in SDTS format.

DRG

A DRG digital raster graphic, is a scanned and georectofied image of the paper version of the U.S. Geological Survey topographic maps.   


Isopleths

An isopleth is also known as a contour line. Shown above is an illustration of the construction of a map, beginning with various values and ending with lines and shadings connecting those points of equal value. They are used for mapping surface elevations, amounts of precipitation, atmospheric pressure and other measurements that can be viewed statistically as a third dimension.

Isopach

An isopach map illustrates the variation of thickness within a tabular unit. They are contour lines of equal thickness over an area. They are used in stratigraphy, volcanology, etc  They are used to assist geologists.


Isohyets


An isohyets is a line joining points of equal precipitation on a map. It is often called a contour line. An isohyets function is a function of two variables and there is a curve along which the function has a constant value. The lines are curved or straight lines on a map. An example would show hills and valleys and steepness of slopes.


Isotachs

Isotachs are lines of equal wind speed drawn on weather maps. They are helpful in finding specific wind patterns. This map shows wind variations.  They are seen often in conjunction with isobars.


Isobars

Isobars are lines of equal atmospheric pressure drawn on a meteorological map. Each line passes through a pressure of a given value, provided certain rules are followed. They are used to define cyclones and high pressure regions.

LIDAR


LIDAR stands for "Light Detection And Ranging".  It is used to measure distance, speed, etc.
It is also a type of remote sensing which uses a laser instead of a radar or microwave sensor.


Doppler Radar

Doppler radar is radar that uses the doppler effect to produce data about objects at a distance.  They are used in air defense, air traffic control, sounding satellites, police speed guns and radiology.  Doppler radar uses a well-known effect of light called the Doppler shift.  The above map depicts a hurricane along the Florida Coastline.

Black and White Aerial Photo

The above map shows an aerial photo of Delaware, Colorado.
Aerial photographs represent a large and heavily used portion of the Map & Imagery Laboratory's spatial data collection.  Aerial photographs exist as positive prints and positive and negative transparencies.  Films designed for black and white aerial photo's have a higher contrast than conventional products because the luminance range of the Earth's surface are seen from altitudes of 5000 ft. or more and they are 100 times lower than that of landscapes photographed horizontally.


Infrared Aerial Photo

Infrared film is sensitive to infrared light.  It is used to document changes in the environment and track various applications.  Most cameras can be used for infrared aerial photos.  Listed above is an outline of an approach that defines visualizations operations or basic visual actions that implement a viewer's task of exploration and characterization of geo-spacial structures in data or phenomena. It uses infrared to show desired areas.


Cartographic Animations

Catographic animation has become a useful technique for representing geographical areas.  They are capable of showing relations between geospatial data's components, location, attribute and time.  The goal of a catographic animation is to be able to visualize something that would not be seen if the maps were looked at individually.  Cartographic animation has emerged as being potentially effective in the world of maps.


Statistical Maps

Statistical maps are used to display the distribution of some variable over a specified geographic area, usually defined by political boundaries. In these maps, each unit is represented by a shading technique or coloring that represents a value. Listed above is an example  illustrating the distribution of the Internet.

Cartograms


A cartogram is a map where an area is not preserved.  Many times they are used to represent the size of populations relative to the area in which they inhabit.  There are two main types - area and distance cartograms.  

The above map is a population cartogram of the world. Asia is shown much bigger, due to its much more abundant population.