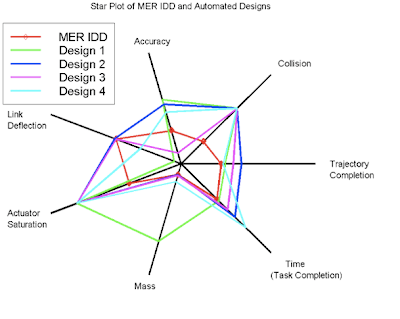
A Star Plot is a geographical method of displaying varying types of data in 2-D. They are represented on axes starting from the same point. It contains a sequence of equi-angular spokes called radii, with each spoke representing one of the variables. Star plots are helpful for small to moderate sized multivariate data sets.
Wednesday, December 2, 2009
Star Plots
Correlation Matrix
A correlation is a single number that describes the degree of relationship between two variables. A Correlation Matrix lists the individual correlations between any two sets of variables.
To locate the correlation for any pair of variables within the matrix, you would need to find the value in the table for the row and column intersection for those two variables. correlation Matrices are quite similar to similarity matrices, except for that correlations have values ranging only from -1 to 1, with -1 representing the least amount of correlation and 1 representing the greatest.
Similarity Matrix
Steam and Leaf Plot
Box Plot
Histogram
A Histogram is a graphical display of tabulated frequencies, shown as bars. It shows what proportion of cases fall into each of several categories: it is a form of data binning. The categories are usually specified as non-overlapping intervals of some variable. The categories (bars) must be adjacent. The intervals (or bands, or bin) are generally of the same size.
Subscribe to:
Posts (Atom)